Lately I’ve been working on stabilizing an application for a client on a test server. Sometimes the server logs won’t give you the answer. You’ve been there many times; “works on my machine”, but not the server.
Remote debugging can be of help, but you’ll headbutt the wall trying to make it work. I ran into some trouble myself. This post was written in response to what I feel is a lack of collected information on the subject.
Disclaimer: I do not recommend trying to remotely debug a production environment. This should only be done in a pre-production setting in order to squash bugs.
Most importantly
The things to remember:
- Symbol-files hold debug information for your application, in .NET these are called PDB-files. They must be available if you want to remotely debug your application.
- The PDB-files are generated when you build your application, and they must match the exact build you have on the server you want to remotely debug.
The second point is probably the one which catches a lot of people unware. You cannot use PDB-files from a different build to debug the exact build which is on the server.
When you build your application, the DLL and PDB-files are embedded with a GUID. The debugger looks for the same name (e.g. YourApp.dll and YourApp.pdb), but it also looks at the GUID. If the GUID doesn’t match between the DLL and the PDB, the debugger won’t load the symbols!
This means it’s important that you keep your symbol-files for each build you intend to deploy.
There are a couple of things to be aware of when trying to make your application debuggable. I’ll go through a few things to consider.
What doesn’t matter
Usually in your Web.config file you will find the following element:
<configuration>
	<system.web>
		<compilation debug="true" />
    </system.web>
</configuration>
Here debug="true" has to do with how your application is compiled and behaves. But, it does not determine if PDB-files are generated.
Among many other things it; makes execution timeouts infinite, disables many optimizations and turns off resource caching.
In your local development environment all these things are useful. But, definitely not in a production environment. With debug="true" you will seriously hinder the application performance, and this is why you’ll usually want to remove it in your server build.
So you want to put <compilation xdt:Transform="RemoveAttributes(debug)" />, or something similar, in the build-transform for your server (e.g. Web.Release.config).
Again, debug="true" has nothing to do with PDB-files, so do not worry about removing this element.
What does matter
If you want to generate PDB-files you will have to change your project properties for the relevant build configurations. You will have to do this for every project you want to debug.
Go to the project properties, and in the Build tab select to relevant build configuration. In my example I want to do this for the “Release” build configuration which I’m going to use in my server deploy1.
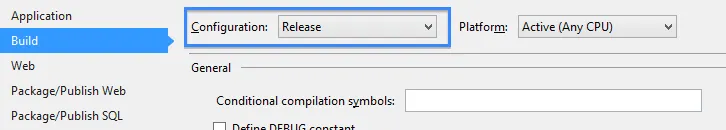
(Sorry for the possible naming confusion with “Release”, but in this solution it is my pre-production build configuration. Go figure.)
Now you can change the properties for this build configuration. If you look in the bottom of the Build tab you’ll find the Advanced button. Here you can change the debug info to specify whether PDB-files are generated or not.
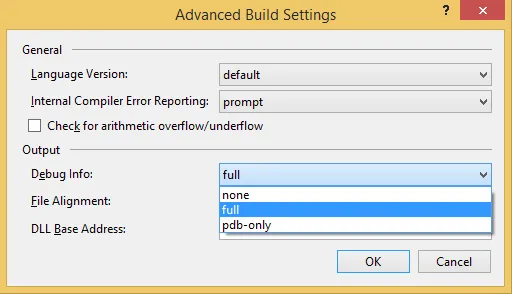
Here your choices are:
- none - no PDB-files are generated
- pdb-only
- full
Both “pdb-only” and “full” will generate the symbol files. What I’ve found in my own debugging is that both will allow you to step through code. But only “full” will allow you to load locals (values) and arguments. For “pdb-only” all values will be “optimized away.”
Another thing which will optimize away locals is the “Optimize code” option in the Build tab. This has mostly to do with the JIT-compiler and its optimizations. Turning this off will of course give you worse performance.
According to MSDN, setting debug to “full” will also give you some impact on performance2. If you choose “pdb-only” you will still be able to step-through and analyze crash dumps.
There is no point in choosing “none” because of fear of performance impact, as generating symbol files will have no impact on the performance of your application.
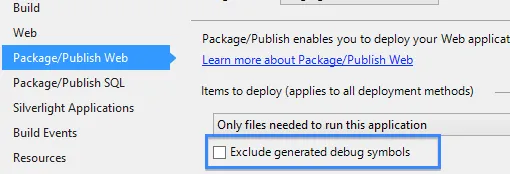
If you’re using publish profiles (*.pubxml) I’d recommend going into your project properties and unchecking “Exclude generated debug symbols” under Package/Publish Web. This also for the relevant build configuration.
That about covers what you need to do with the project files. Now your project-file (*.csproj) will contain something like this:
<PropertyGroup Condition=" '$(Configuration)|$(Platform)' == 'Release|AnyCPU' ">
 <DebugType>full</DebugType
 <ExcludeGeneratedDebugSymbol>false</ExcludeGeneratedDebugSymbol>
 <DebugSymbols>true</DebugSymbols>
 <Optimize>false</Optimize>
</PropertyGroup>
What you need to do on the server
In order to debug remotely you’ll have to install remote tools on the server. There are of course a few other pre-requisites to make this work:
- You have to be connected over network to the server for remote debugging.
- You must be an administrator to install the remote tools on the remote server.
- To communicate with the remote tools, you must have user access to the remote server (e.g. a domain account).
- The remote server must be running the remote tool when you want to debug.
There are multiple versions of the remote tools, choose the download that matches your Visual Studio version, and the operating system on the server. After the remote tools are installed you’ll need to do a few more things to make it work.
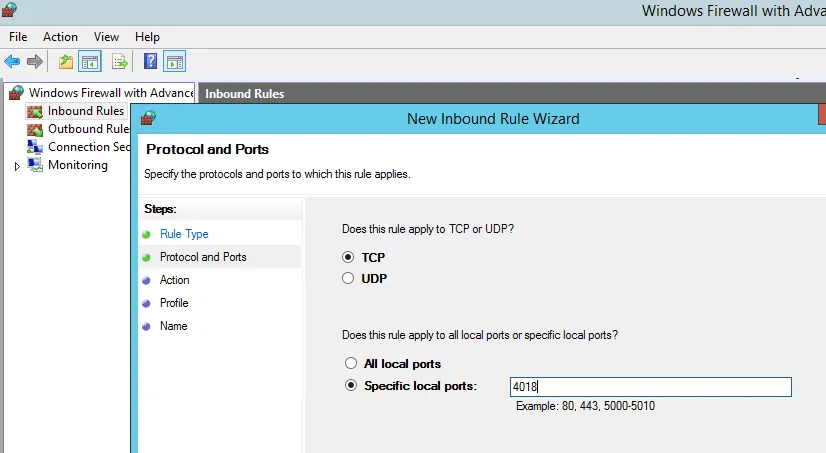
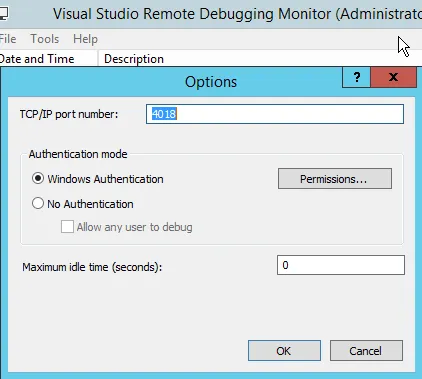
If you have a firewall in front of the server you’ll need to open up port 4018, which is used for remote debugging. If you have Windows Firewall on the server you can open up this port by going to Advanced Settings on the Windows Firewall and adding an Inbound rule to open up port 4018.
You can set security on this rule as appropriate, for example by only allowing connections from authenticated users.
When starting the Remote Debugger (as the server tool is called), I’d recommend right-clicking and “Run as administrator”. Now go to Tools > Options and set authentication mode to Windows Authentication, then click permissions and add the user you want to use for debugging (from Visual Studio).
It is possible to run the Remote Debugger as a service, but this is generally not recommended. If you wish to do so you can run the Remote Debugger Configuration wizard to set this up.
One last thing; in order for the debugger in Visual Studio to attach to the process, it needs to have access to the PDB-files somehow. If you do not have a Symbol/Source server3, then probably the easiest way to accomplish this is through file share.
Since I do not want to share the \bin folder from my solution web root, I normally copy my PDB-files into their own \symbols, and share this on the network. Later you’ll need to define the network path to this folder in Visual Studio.
A minor issue here is that Visual Studio won’t allow you to authenticate to this folder, so either authenticate by visiting it explicitly outside VS4, or share it with “Everyone”.
Debugging in Visual Studio
First off, to state the obvious, the source files you’re attempting to use for debugging should match the release that is on the server. Retrieve it from version control if you have to. You’ll still likely run into some problems when debugging remotely, so there’s a few option you should set.
In Visual Studio, go to Tools > Options > Debugging > General and:
- Uncheck “Enable Just My Code”
- Uncheck “Require source files to exactly match the original version”
Then go to Symbols under Debugging. Click the folder-icon up right to define your own symbol locations. Here the network path to your symbols folder (as defined in the previous section) should be put, and remember to check the box next to the path. Again Visual Studio will not let you authenticate here, so you should do it manually somehow4.
Since the process of downloading the symbols might be slow, you should define a directory to cache them in (as shown below).
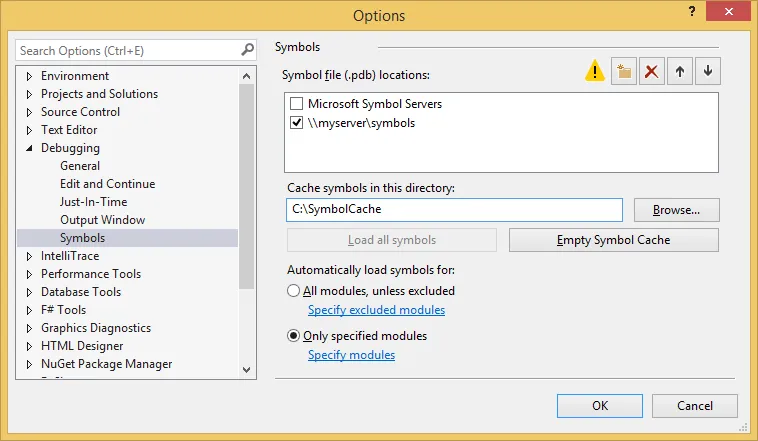
Next I recommend checking “Only specified modules”, then click the link below it to specify which modules you want to debug (e.g. YourApp.dll).
Now finally, we’re ready to start debugging!
Go to Tools > Attach to Process (CTRL + ALT + P, handy shortcut).
The Transport should be Default. In the Qualifier (where your computer name probably is), type the IP/host of the remote server, and add port 4018. For example myserver:4018.
Next press Enter and you will most likely be prompted to authenticate. Login with the user as defined in the remote tools on the server.
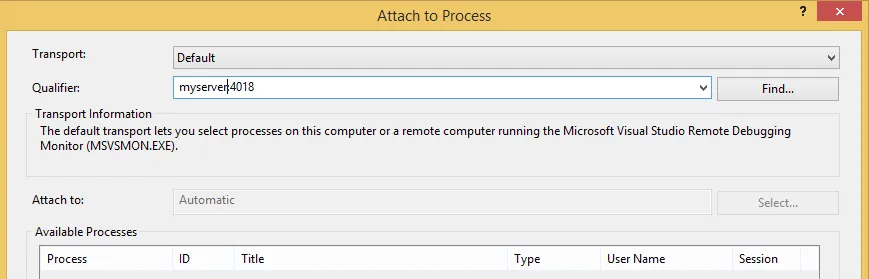
Check “Show all processes from all users”, and select the w3wp.exe or whichever process which corresponds to your application (make sure it’s running). Next click Attach, and you’re off!
If your symbols are not loading automatically you might have to do it manually. While attached to the process, in VS go to Debug > Windows > Modules. Scroll down to the module you want to debug, right-click and select “Load Symbols”.
If it’s still not loading, either the network path is not reachable, or the symbol does not match the assembly (remember the GUIDs). You can also right-click the module and select “Symbol Load Information” to see where the debugger has looked, and the results of that search.
That’s all there is to it, I hope this will be of help to you!
Footnotes:
If you’re going to change the properties for a lot of the projects in your solution, it would be easier to set the relevant build configuration in the top of Visual Studio under your menu bar. This is because your project properties can also track the “Active” build configuration. If you’re going to switch between build configurations to compare though, it’s faster to do this in your project properties.
This MSDN article might be out-dated, and “full” might not give you that much of an performance impact. According to some there is no difference between “pdb-only” and “full”, and that they only exist for historical reasons. If you’re going to do a lot of debugging on the remote environment, then the performance trade-off might be worth it (or possibly non-existent).
A Symbol Server lets your index your PDB-files for releases, Source Server does the same for source files. This makes for easier retrieval of these files if you need to debug certain releases. If you’re using Team City to build and test your releases, you could make indexing your symbol files and source files as a part of the build.
You could also “Map a network drive” in Windows to automatically re-authenticate.
